
 Flint: A Visualization Language for the AI Era


Project site · 中文主页 · MCP server · Gallery
Flint lets AI agents reliably create expressive, good-looking and interactive charts from simple, human-editable specs. Good-looking charts usually take verbose low-level settings that tangle visual, style and interaction logic together; Flint moves that work into a compiler, so the spec stays short.
Use it as an MCP server with your agent, or as an npm library in your app. Flint supports 52 chart types across 5 rendering backends (Vega-Lite, ECharts, Chart.js, Plotly and native Excel charts), with 14 preset themes and 23 interaction presets.
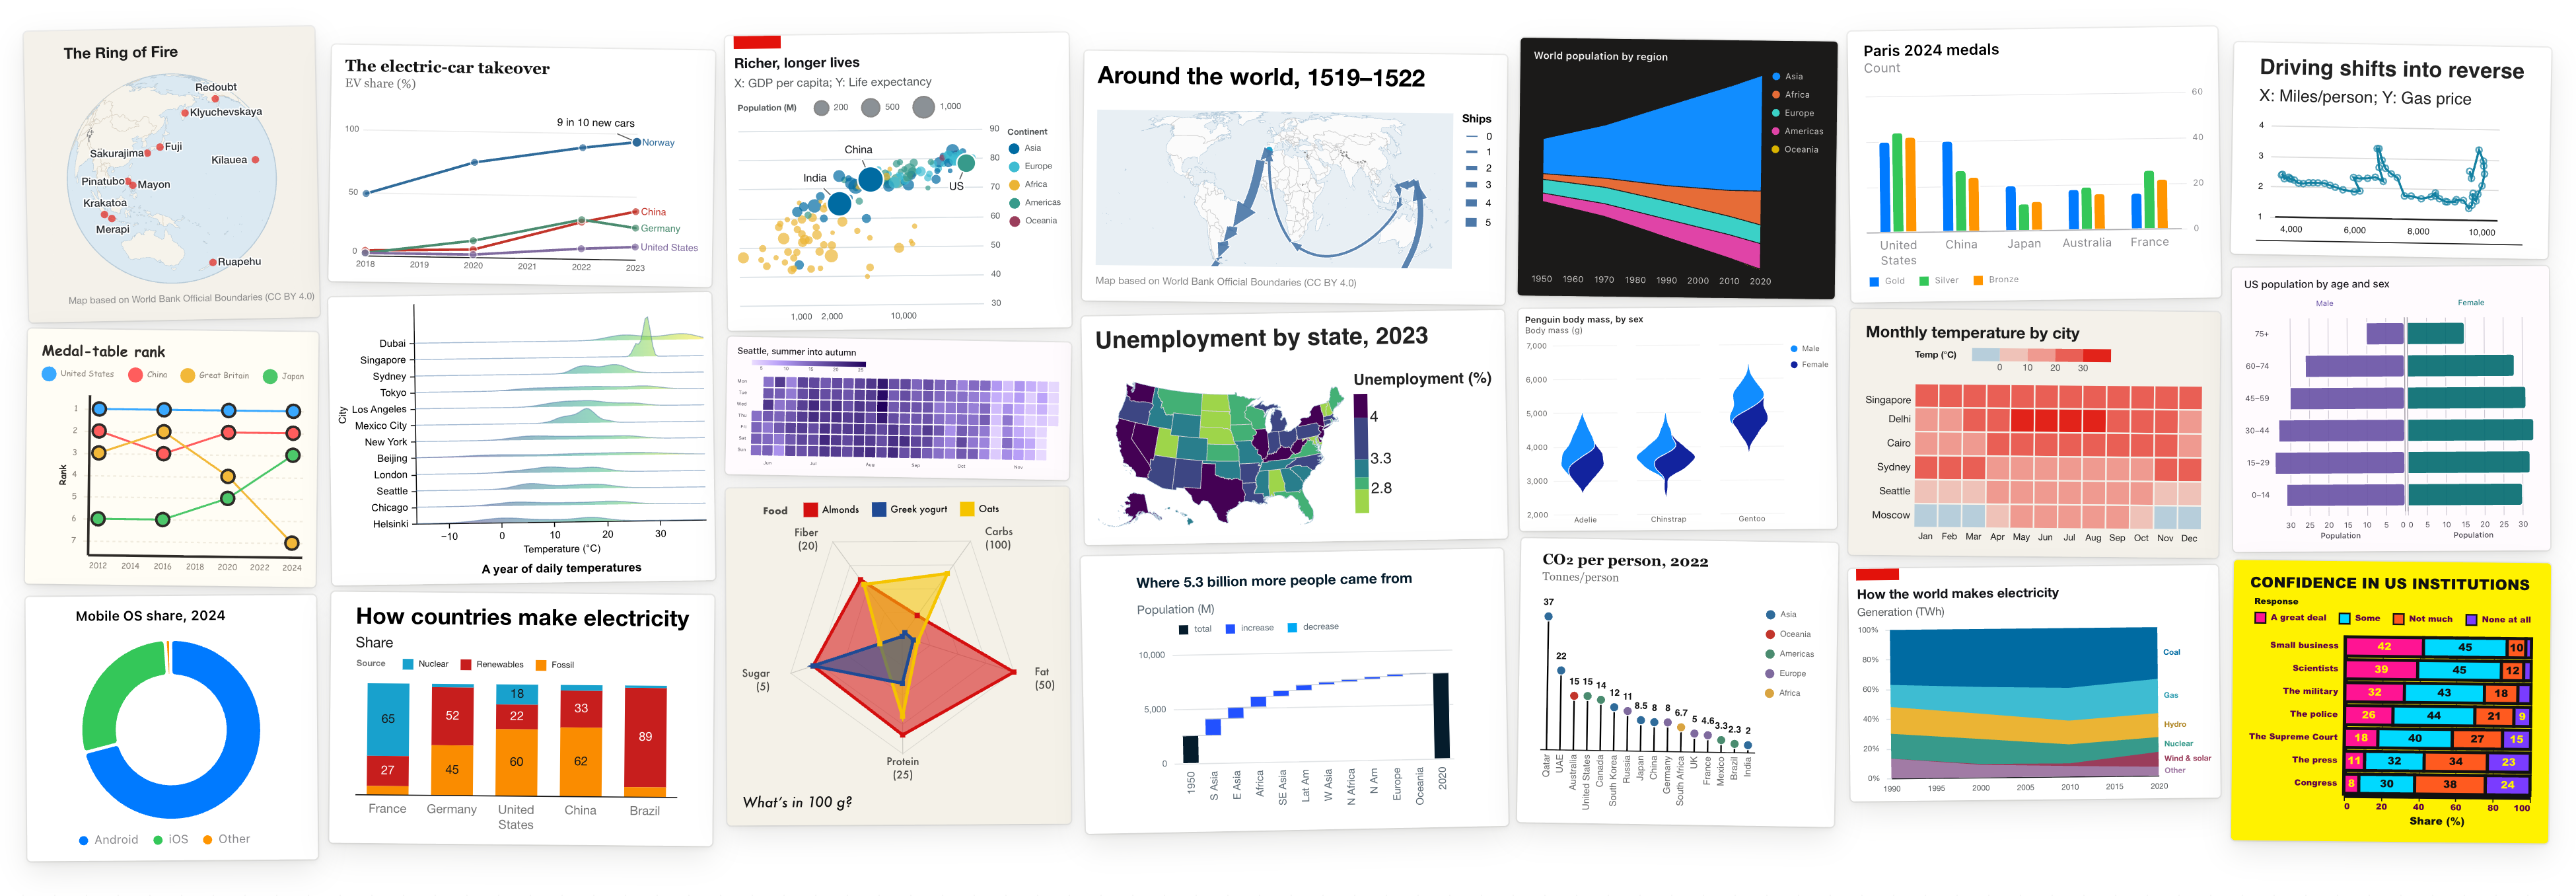
flint-interactive-EN-white-web.mp4
🔊 Click the speaker icon for sound

Updates
- November 15, 2026 — Flint 1.1 brings maps and layout: maps with customizable boundaries, globes, routes and labelled points, framed to their data; charts that fit their canvas on every backend; and annotations as captions beside what they name. (release notes)
- October 19, 2026 — Flint 1.0 introduces Flint Interactive: interaction presets, semantic events, and an interaction API that connects charts to your app.
See the changelog for every release.
Quick start
With your agent (MCP server)
Paste this into your agent, such as GitHub Copilot, Claude Code, Codex or Cursor. It adds the Flint MCP server and draws your first chart:
Help me set up Flint as an MCP server named "flint"!

1. Add it to my client config, using whichever option my client supports:
   - a local (stdio) server: npx -y flint-chart-mcp
   - the hosted server over HTTP: https://flint.data-formulator.ai/mcp
2. Verify the setup by listing the available Flint chart types.
3. Show me a fun first chart: how many moons each planet has, in a Flint theme you like.
Then ask for charts in your own words, such as "compare today's change for the Magnificent Seven stocks in Economist style, and let me hover to read each one". The agent opens a live chart in the conversation, or returns a PNG, an SVG or a backend-native spec. To set it up by hand, see the MCP server guide.

In your app (npm library)
npm install flint-chartimport type { ChartAssemblyInput } from 'flint-chart';
import { FlintChart } from 'flint-chart/react';
const spec: ChartAssemblyInput = {
data: { values: [
{ Month: '2026-01', Users: 1200 },
{ Month: '2026-02', Users: 1800 },
] },
semantic_types: { Month: 'YearMonth', Users: 'Quantity' },
chart_spec: { chartType: 'Line Chart', encodings: { x: 'Month', y: 'Users' } },
theme_spec: 'economist',
interaction_spec: { interactions: [{ type: 'inspect-index' }] },
};
<FlintChart spec={spec} />flint-chart comes with every backend it draws with; React is an optional peer,
needed only for <FlintChart>. Without React, mountChart from
flint-chart/interactive mounts the same chart in any page, and
assembleVegaLite, assembleECharts, assembleChartjs, assemblePlotly and
assembleExcel compile a spec into each library's own. To have your coding agent
build it, point it at Flint's
chart and
interaction authoring skills.
How it works
A Flint spec is the data, semantic types, a chart spec, and optional theme and interaction specs. Instead of leaving the glue to you, the compiler resolves each part against the others and composes a complete spec for the backend.

- Describe data with semantic types. Fields carry types such as
Rank,YearMonth,DeltaorTemperature, with their domains and units, and the compiler infers parsing, scales, axes, formatting and colors from them. - Build charts with library-agnostic chart specs. Charts name a chart type and its encodings; the compiler sizes, spaces and labels them for their data, and the same spec renders on every backend. See the gallery.
- Unify the look with a theme spec. Pick a preset such as the New York
Times, the Economist or Swiss, or extend one with your brand:
{ extends: 'economist', id: 'our-brand', ink: { series: { single: '#6b3fa0' } } }. See the theme explorer and the Theme Lab. - Add interactions with an interaction spec. Brushing, hover readouts, legend toggles and more; the compiler turns a reader's gestures into semantic events, so your app answers with high-level chart updates. See the interaction gallery and advanced interactions.
Documentation
- Project site: gallery, live editor, themes and interactions
- API reference, with backend references for Vega-Lite, ECharts, Chart.js, Plotly and Excel
- Theme guide, interaction spec and interaction API
- MCP server guide and agent skills
- Paper on arXiv
A Python port is in preview as source in packages/flint-py;
its package is not yet released.
Contributing
Contributions are welcome, especially new chart templates and rendering backends. See CONTRIBUTING, and the development guide for setup, commands and the repository layout. Pick up an issue, add a chart template or a theme, or share what you build.
Community
Join the Flint Discord to ask questions, share your charts and follow releases.
Flint WeChat group

Code of conduct, security and trademarks
This project has adopted the Microsoft Open Source Code of Conduct. See SECURITY.md to report vulnerabilities.
This project may contain trademarks or logos for projects, products, or services. Authorized use of Microsoft trademarks or logos is subject to and must follow Microsoft's Trademark & Brand Guidelines. Use of Microsoft trademarks or logos in modified versions of this project must not cause confusion or imply Microsoft sponsorship. Any use of third-party trademarks or logos is subject to those third parties' policies.
License
MIT © Microsoft Corporation
